Election is a key component in every democracy for selecting persons to serve in executive and legislative roles for effective public government. An autonomous electoral organization established by constitution primarily organizes this component. Stakeholders are expected to cooperate with the electoral body during the election cycle, including governmental and non-governmental organizations as well as individuals.
Nigeria has had a hybrid form of democratic and military rule, similar to other developing-world democracies. Before the nation’s restoration to democracy in 1999, the military served as the country’s president and administration for more than 30 years. Early in the 1960s, the nation mostly benefited from a democratic system of government.
The same held true for the 1970s and 1980s. During these years, the two- and multi-party systems were operated to varying degrees of success. Violence that followed the conclusion of the presidential elections in both years will not soon be forgotten by Nigerians who witnessed the political unrest that characterized general elections held in 1962 and 1983. Because their candidates and parties lost the elections, political parties and their supporters killed, set fire to homes and destroyed property.
Register for Tekedia Mini-MBA edition 19 (Feb 9 – May 2, 2026): big discounts for early bird.
Tekedia AI in Business Masterclass opens registrations.
Join Tekedia Capital Syndicate and co-invest in great global startups.
Register for Tekedia AI Lab: From Technical Design to Deployment (next edition begins Jan 24 2026).
However, the purpose of this essay is not to reacquaint Nigerians and their allies with the history of earlier electoral violence. It merely aims to educate students on what counts as a decided vote and a wasted vote from a quantitative and contextual standpoint. Over the years, the third-party candidate winning the electoral vote has been a surprising event in both industrialized and emerging democracies. This, for instance, has been based on the alliance and incumbency factors in Africa, where these characteristics typically gave the ruling party (the first party) and main opposition (the second party) the potential to win the most electoral votes.
The Swing and Block Votes
These are the two primary vote categories developed in response to the nature and characteristics of Nigeria’s elections since 1999. Between 2003 and 2019, the two modes were primarily crucial in how parties become the first party, second party, and third party. Voters tend to switch parties whenever they feel excluded or marginalized and discriminated because of religious identity. Due to the spread of our turn agenda throughout regions, the two types of votes have also been recorded. Political scientists and public affairs analysts, however, contend that politicians and candidates court swing voters when it is clear that they cannot effectively sway voters in a certain area or region due to a perception of low popularity and significance. Votes from states with a sizable number of residents who registered to vote are referred to as “block votes” in the context of Nigeria. Politicians and their supporters typically work zealously to secure significant votes from states with the greatest voter turnout because winning elections depends on having a large number of voters. Kogi State is the state with the largest block of votes coming from the north-central region, according to an analysis of historical voting patterns and registered voters. For the northeast and northwest, respectively, there are the states of Borno and Kano. While Akwa-Ibom and Lagos have primarily delivered block votes from the south-south and south-west regions respectively. Imo State represents the south-east region.
The Decided and Wasted Votes
Politicians, candidates, and their followers contributed to the decided and wasted vote categories throughout the struggle for the two vote kinds, which ultimately determined which party finished first, second, and third after elections through heavy campaigning. Voters are naturally in dilemma about who to vote for based on conflicting messages and incentives distributed by candidates and parties. Because of this and the knowledge that his or her vote cannot be used to propel a party to the top, most voters enter the voting booth with conflicted mindsets. Political scientists note that decided votes have occurred when results are made public and it becomes clear that the party or candidate the voter selected won the election. Votes that were cast in vain when the candidate lost have been noted. In this piece, it is called wasted votes.
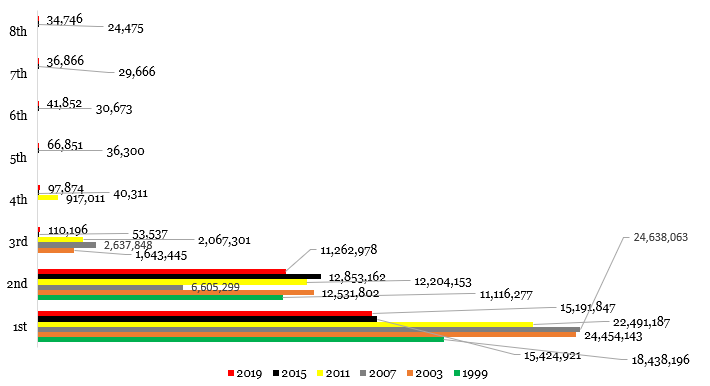
Exhibit 1: Parties that received decided and wasted votes per election year

Due to the lack of third through tenth parties in 1999, there were only two parties that participated. Three parties competed in 2003, and the third party automatically represented the party that lost votes. Votes were squandered for a third party (ACN) and the same number of parties as in 2007. There were four political parties in 2011, and the third (ACN) and fourth (ANPP) garnered the most ineffective votes. The 2015 presidential election featured 14 political parties. 73 political parties ran candidates in the 2019 election. Our data reveals that multiple parties received wasted votes in 2015 and 2019. (see Exhibit 1).
Exhibit 2: Votes received by top Parties per election year

The People’s Democratic Party retained first party status from 1999 to 2011, which, according to an earlier definition of a decided vote, shows that the party has received more decided votes than other political parties since the nation’s restoration to democracy. When the newly created alliance political party, the All Progressives Congress, beat it in 2015 and 2019, this rank switched to second. APGA, Action Congress of Nigeria, the African People’s Alliance and the People’s Coalition Party received more wasted votes than other parties between 2003 and 2019. (see Exhibit 1).
Average Votes for Parties that received Decided and Wasted Votes
The 1999 presidential election’s lack of competitiveness was largely due to the small number of political parties who participated, as previously mentioned. 14,777,236 votes were cast on average for the two parties. As more political parties were formed and approved by the electoral authority in 2003, the average number of votes rose to 12,876,463. In 2007 and 2011, the average fell to 11,293,736 and 9,419,913, respectively. Significant decreases were found in 2015 (2,853,962) and 2019 (2,690,584), when 14 and 73 parties participated in the elections. In our analysis, a huge contrasting connection was found for the results received by the People’s Democratic Party and Alliance for Democracy-All People’s Party in 1999 with other election years (2003, 2007, 2011, 2015 and 2019). According to our analyst, this is largely due to none competitiveness of the election because two political parties participated in the election. Two political parties involved in the election because the country’s democracy remains nascent at the time.
Similar trends were seen in the outcomes obtained by the parties that participated in the elections in 2003 and 2011. Because four parties fielded candidates in the 2011 election, compared to three parties in the 2003 election, the contraction was noted. Therefore, electorate did not have many alternatives to choose from like what happened in 2015 and 2019, where the Independent National Electoral Commission registered more political parties in line with the new Electoral Acts and Regulations. According to our data, there was a 99.8% connection between the top 10 political parties’ 2019 and 2015 results, showing intense competition in the two elections.
Moving Average of Wasted Votes
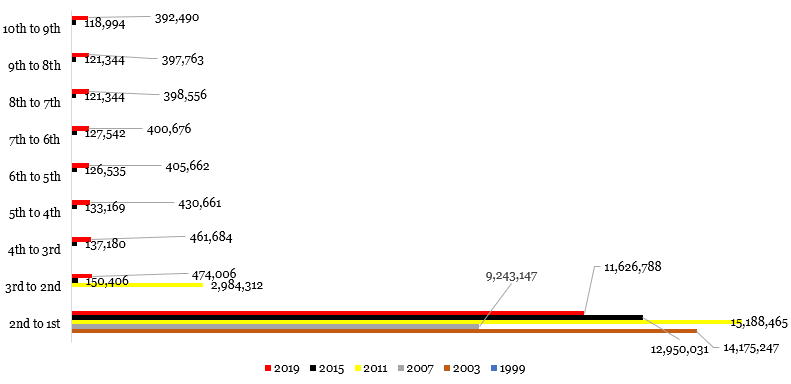
Since it is obvious that voters often face a natural decision when casting their ballots, our analyst looks at the likelihood of wasted votes for the parties that were in third to tenth place in order to gauge how they compare to the parties in first and second place. A third-place party’s squandered votes were added to the votes it had actually obtained for the examination. With the inclusion of own votes and votes acquired by a party that was in fourth place, the third party is specifically shifted to second position. This strategy was used for all the parties that received wasted votes (see Exhibit 3). On average, wasted votes were high in 2003 (14,175,247), 2007 (9,234.147) and 2011 (9,086,388). In 2003 (14,175,247), 2007 (9,234.147) and 2011 (9,086,388) there were a lot of wasted, on average. Our data shows that the number of voters who voted for third to tenth parties dramatically decreased in 2015, from over 9 million recorded in the previous elections to 1,554,060 and then slightly increased in 2019, to 1,665,365.
Exhibit 3: Movement of Parties from Lowest to Highest Positions Using Received and Wasted Votes

Weighted Analysis and Predicted Wasted Votes
Further analysis indicates that the more the first through the tenth parties received decided votes the more votes were equally wasted. In 2015, one decided vote led to over 70 wasted votes. This was increased by 5 votes in 2019. Overall, our weighted analysis reveals that 55.9% of decided votes were accounted for in the wasted votes. It was 62.5% for the 2019 presidential election. These suggest that voting parties that have high propensity of unlocking the natural dilemma of making appropriate decision should be always considered by the electorate. From all the analyses, it is clearly shown that third through tenth parties hardly close to the second and first parties despite the number of votes they received (after adding received and wasted votes). Therefore, it makes sense for voters to concentrate on elevating the second party to the top spot. This, however, can only occur as anticipated when the electoral body and other political institution actors play the game of registering parties and running campaigns in accordance with international best practices and constitutional provisions.


Great perspectives Mutiu. Nice quantitative one.